
ARTData Quick Reference Guide
- Sep 6, 2025
- 6 min read
Updated: Sep 29, 2025
Platform Summary
ARTData stands for Advanced Real-Time Data Processing Platform for OT and Edge. It offers an advanced processing layer on top of PLC/SCADA/DCS while also capable to operate as a standalone control center if connected to devices directly. ARTData extends traditional supervisory control with customised business logic capabilities and powerful data analytics all integrated into OT environment.
ARTData can be applied in a number of use cases including idustrial ML applications, model-based prediction and alerts, model-predictive control, real-time system identification, parameters scheduling for batch processes, procedural automation and IIoT sensors data processing.
Some key feature of the platform:
Configuration of real-time computations using Python and SQL;
User-friendly web-based interface;
OPC UA communication interface;
Dashboard-style web-based visualization tool;
Runtime reliability and redundancy;
Scan-time based computation execution;
Tag-based address space;
Version control;
Custom modules import in runtime;
Relational SQL database storing real-time and timeseries data.
Remote Access
ARTData user interface can be accessed from a web browser. Depending on a hosting option login page (Fig. 1) can be accessed via:
Remotely hosted demo server: http://artdata.profsys.au:30700/ Use Demo User button for view-only access.

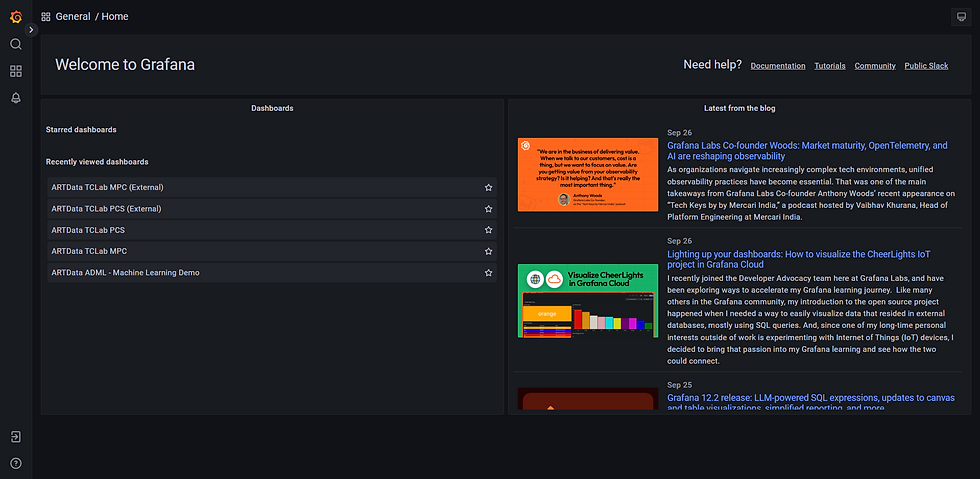
ARTData platform includes visualisation tool Grafana that requires a separate login. Its login page (Fig. 2) can be accessed via:
Remotely hosted demo server: http://artdata.profsys.au:30300/
Provides view-only access without login.
Platform Tools Overview
Once logged in to the platform, various tools can be accessed from the palette (Fig. 3).

3.1 Database Controls
The largest logical entity of ARTData is database. On the data level, a database consists of real-time and time-series data tables. Each table can be pictured as a spreadsheet having static columns header and dynamically added records, rows. The default and mandatory columns are (Fig. 4):
timestamp – contains date, time and time zone associated with a record;
tag_id – is an abstract logical object corresponding to a piece of instrumentation, some calculation or algorithm. For example, tag_id can be a flow controller recorded as FC-100;
metric – is a variable which is a part of tag_id. For example, FC-100 flow controller can have set point metric called SP;
metric_value – value which metric attains at specific timestamp;
metric_status – property related to the metric_value that characterises if the value is trustworthy or not. There are two statuses defined: Good and Bad. Often, some fallback strategies apply if the status is Bad.
More custom columns can be added, for example, to record relation to a specific group (e.g. process unit). Custom columns can have default values sets which can be added during table configuration, and then later used to select an attribute from drop-down list.
A real-time table can contain only single record for each combination of tag_id and metric. Hence, only latest timestamp applies to each tag_id and metric in the real-time table.
A time-series table can contain many records for each tag_id and metric combination providing time dimension of the data. Time-series table can be viewed as data historian. To prevent infinite growth of time-series tables, a cutoff period can be specified individually for each table and data older than the cutoff is periodically removed.
The real-time and time-series tables are equally accessible for data processing and communication interface configuration.
Each database has independent workers assigned to it:
Regular data processing – generally runs heavier workloads with a larger execution period;
Fast data processing – runs smaller and more critical workloads on faster execution period;
OPC UA Read – OPC UA Client interface for reading data from remote system and recording it in ARTData database tables;
OPC UA Write – OPC UA Client interface for writing data from ARTData database to remote systems.
There is no logical limit on the number of databases that can be configured. It can be constrained by hardware resources though. To manage additional computational load new ARTData hardware nodes can be added and connected to the master node.
Each database configuration can be saved in a back-up file and restored from it if needed.

3.2 Data Processing
Data Processing is in the core of ARTData. It performs the primary function of the platform – running business logic configured by user. UI provides overview of all Data Processing Items (DPIs) (Fig. 5).

Data Processing Item (DPI) corresponds to tag_id in the data structure. To change tag_id, description and configuration, DPI needs to be opened for editing (Fig. 6).

DPI is built of configurable variables calculated sequentially. Some variables are used to assign their values to DPI metrics, which are then saved in the database tables (Fig. 7).

ARTData allows to track DPI dependencies (or links) with other variables and provides visualisation tool for that (Fig. 8).

There are 3 types of variables in ARTData data processing (Fig. 9):
TagID – quick-to-setup reference to an existing tag_id and metric already present in the database tables;
SQL – allows to insert a custom query to the database to retrieve specific data;
Python – a single line Python expression.
After the variables are defined it is possible to evaluate them safely before saving the change (Fig. 10). This helps in quality check and troubleshooting.


Commonly used Python modules are pre-imported into the run time and can be referenced in the Python variables directly:
datetime
base64
numpy as np
pandas as pd
The available Python modules on top of standard libraries include:
tzlocal==4.3
backports.zoneinfo==0.2.1
numpy==1.21.2
pandas==2.0.3
scipy==1.7.1
scikit-learn==1.1.1
pmdarima==2.0.4
pysolar==0.13
multiprocess==0.70.12.2
gekko==1.2.1
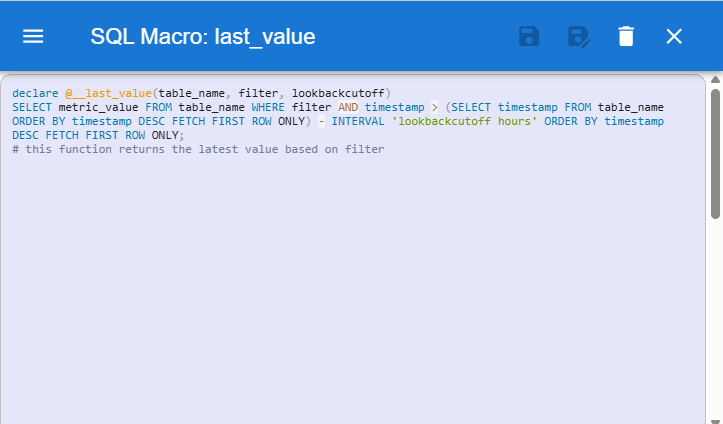
Data processing always involves using functions, classes and modules that are custom built for a specific task. To enable developing and using such functions, Python plugins can be imported on the General Settings view (Fig. 11) using Plugins Editor (Fig. 12). Classes and functions defined in the plugins can be referenced directly in the Python variables as plugin_name.class_name and plugin_name.function_name. Similarly, SQL Macro editor (Fig. 13) allows to wrap complex SQL queries into simplified macro functions which can be used in format @macro_name(argument_1, argument_2, …, argument_n).


General Settings view of the data processing tool provides possibility to configure running periods of fast and regular processing workers. It also lets setting parallelisation method for running DPIs calculations in parallel. Following methods are available:
coroutine (use for IO-intensive tasks to run them concurrently on a single core);
multithreading (use for IO-intensive tasks where idle CPU cores are available);
multiprocessing (use to run CPU-intensive tasks in parallels on different cores).
3.3 OPC UA Interface
ARTData platform can receive and send data to external systems using OPC UA interface. The UI provides OPC UA sessions tree where remote OPC UA servers can be browsed. A new session can be configured using session name, endpoint URL and user credentials (Fig. 14).

When OPC Variable is selected in the browse tree, it can be added to the list of OPC UA Read Items by assigning it a unique tag_id and metric on Read view (Fig. 15).

For each unique endpoint URL of an OPC UA server OPC UA Client must be configured on Settings view (Fig. 16). Separate clients can be configured for read and write operations with the same OPC UA server endpoint URL. Configuration includes read and write periods, connection timeout and reconnection period. Security is provided by applying username and password client authentication.

To write values from ARTData to external systems via OPC UA, OPC UA Write Items can be configured on Write view (Fig. 17). This is done by specifying source database table, tag_id, metric and pointing to corresponding OPC UA client and item path on the remote OPC UA server.

3.4 File Transfer
Providing common file system access to data processing workers, File Transfer utility runs in the background. Some workloads require objects being stored on a drive rather only existing in memory. For example, storing ML models and configuration files, saving logs and reports all can be done using this file system. Working folders are created for each database. From within new folders can be added, files uploaded and downloaded (Fig. 18).

3.3 OPC UA Interface
Grafana is an open-source observability platform used to query data from various data source types, visualise it and set-up threshold-based alerts. It enables users to create interactive, dynamic dashboards with a variety of visualization panels.
Grafana web server is hosted within ARTData platform and listens on port 30300 providing visualisation capabilities for real-time and time-series data (Fig. 19). More one the login process is here. Grafana also enables interactivity by using ARTData REST API calls so that user can initiate commands and enter values.

Abbreviations
Abbreviation | Full description |
DCS | Distributed Control System |
DPI | Data Processing Item (ARTData) |
IP | Internet Protocol address |
ML | Machine Learning |
OPC UA | Open Platform Communications - Unified Architecture |
OT | Operational Technology |
PLC | Programmable Logic Controller |
REST API | Representational State Transfer Application Programming Interface |
SCADA | Supervisory Control and Data Acquisition |
SQL | Structured Query Language |

Comments